Important things to know:
- One canbody cycle = 0 – 360 °
- “Mclk Sync Deg” stands for Machine clock synchronization (in °). You can shift the clock/cycle signal (0-360 °) in order to get a proper synchronization of the graph to the measured canbody.
- A smaller value will shift the graph to the left,
- a bigger value to the right.
1. Problem:
The graph is not showing any values / no picture at all.
Possible Causes & Resolutions:
- The first parameter “Mclk Sync Degree” has a “dead area”, where the tool sensor detected the gap between the two cans, rather than the cans. As a result, there might be no graph showing. No graph showing means the system is not detecting that a can was welded.
➔ If no graph is shown, try to enter values in large steps. You should now see a graph but might have to adjust the measured area. Please see second problem for the resolution.
2. Problem:
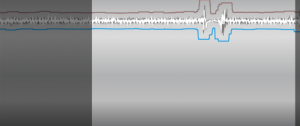
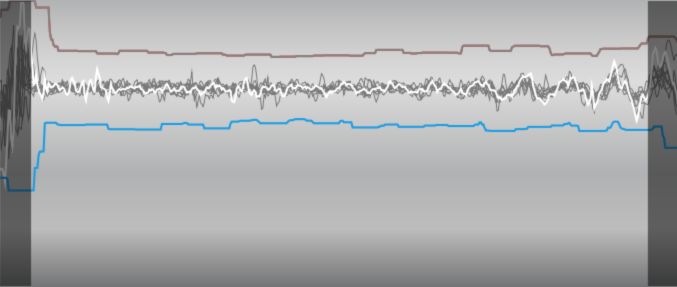
The graph of the G-Sensor does not show a steady graph but shows greater fluctuations (= can gap).
Possible Causes & Resolutions:
- The G-Sensor is not correctly installed and measures outside the canbody cycle.
➔ In order to remove the greater fluctuations out of the graph-frame, increase the “Mclk Sync Degree” value to shift the graph to the right, and decrease the value to shift the graph to the left.
Example: Your graph looks like the left picture below. You will have to decrease your value by about 40° in order to receive a graph like on the right.E.g. you have a value of 180° and have to decrease by 40° = enter 140° OR you have a value of 20° and have to decrease by 40° = enter 340° (canbody cycle goes from 0-360°)